by Purva Dalvi and Ritika Panattu
Brief
Create a calendar for 2020. Every month should have a graphic representation of the key world event. The months yet to come should have a predictions of the expected event of the month.


Concept Note
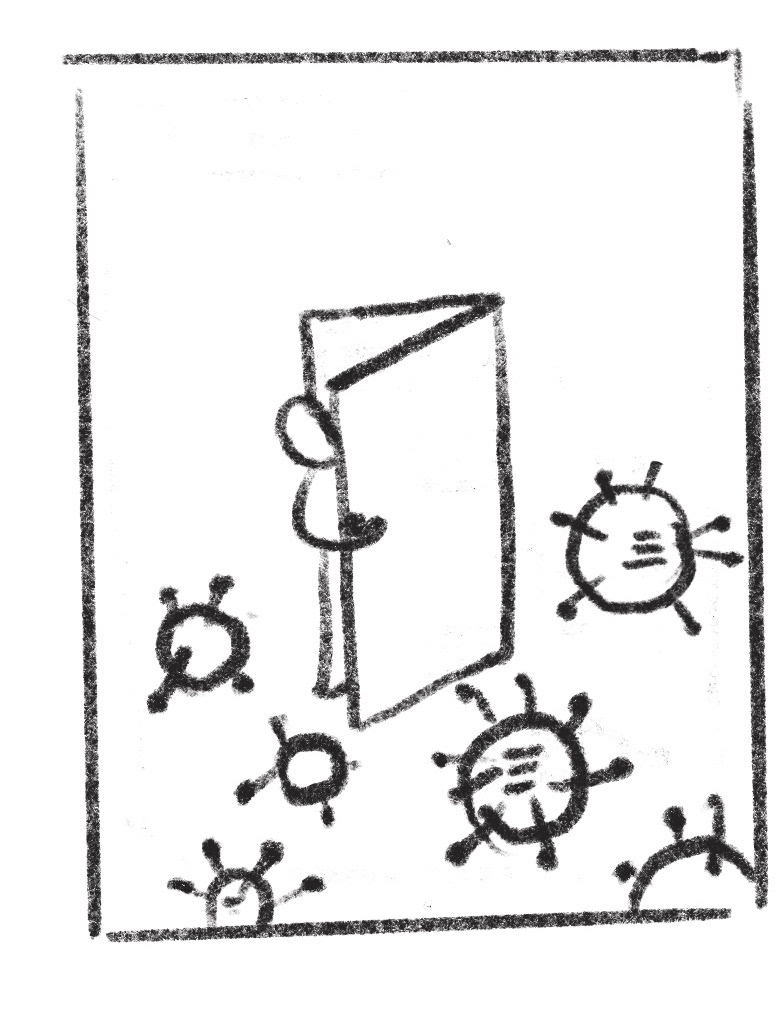
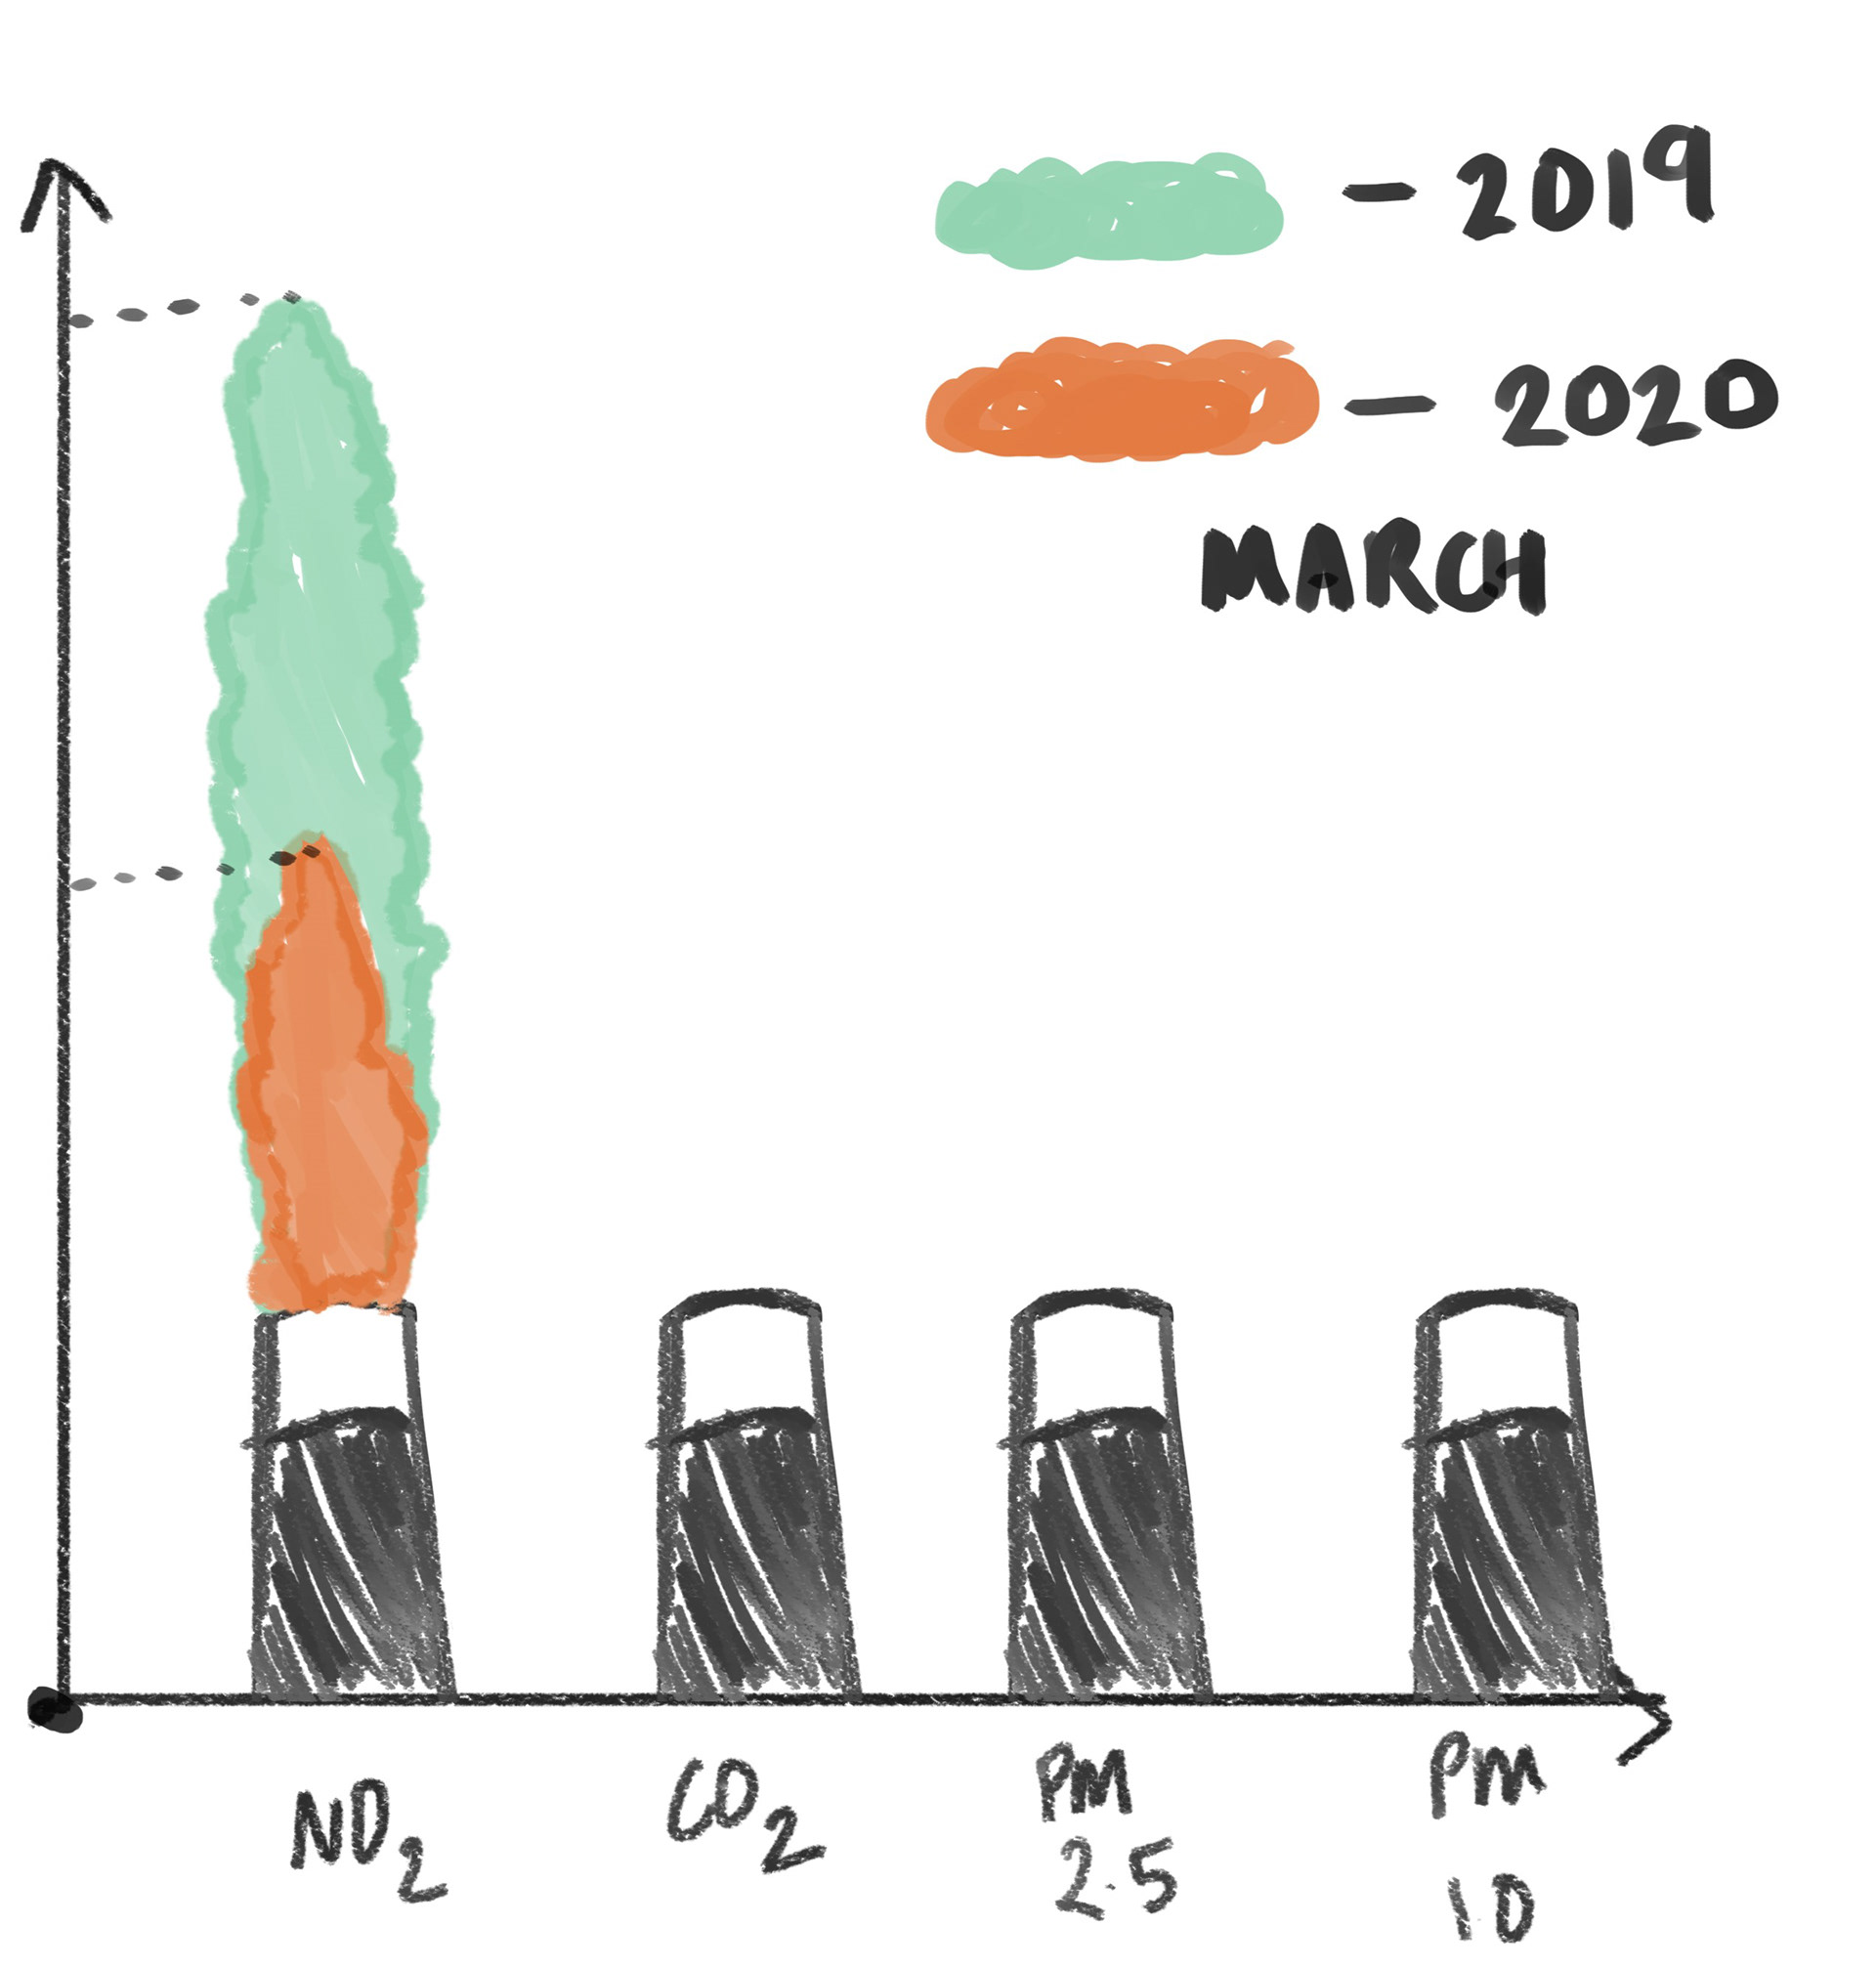
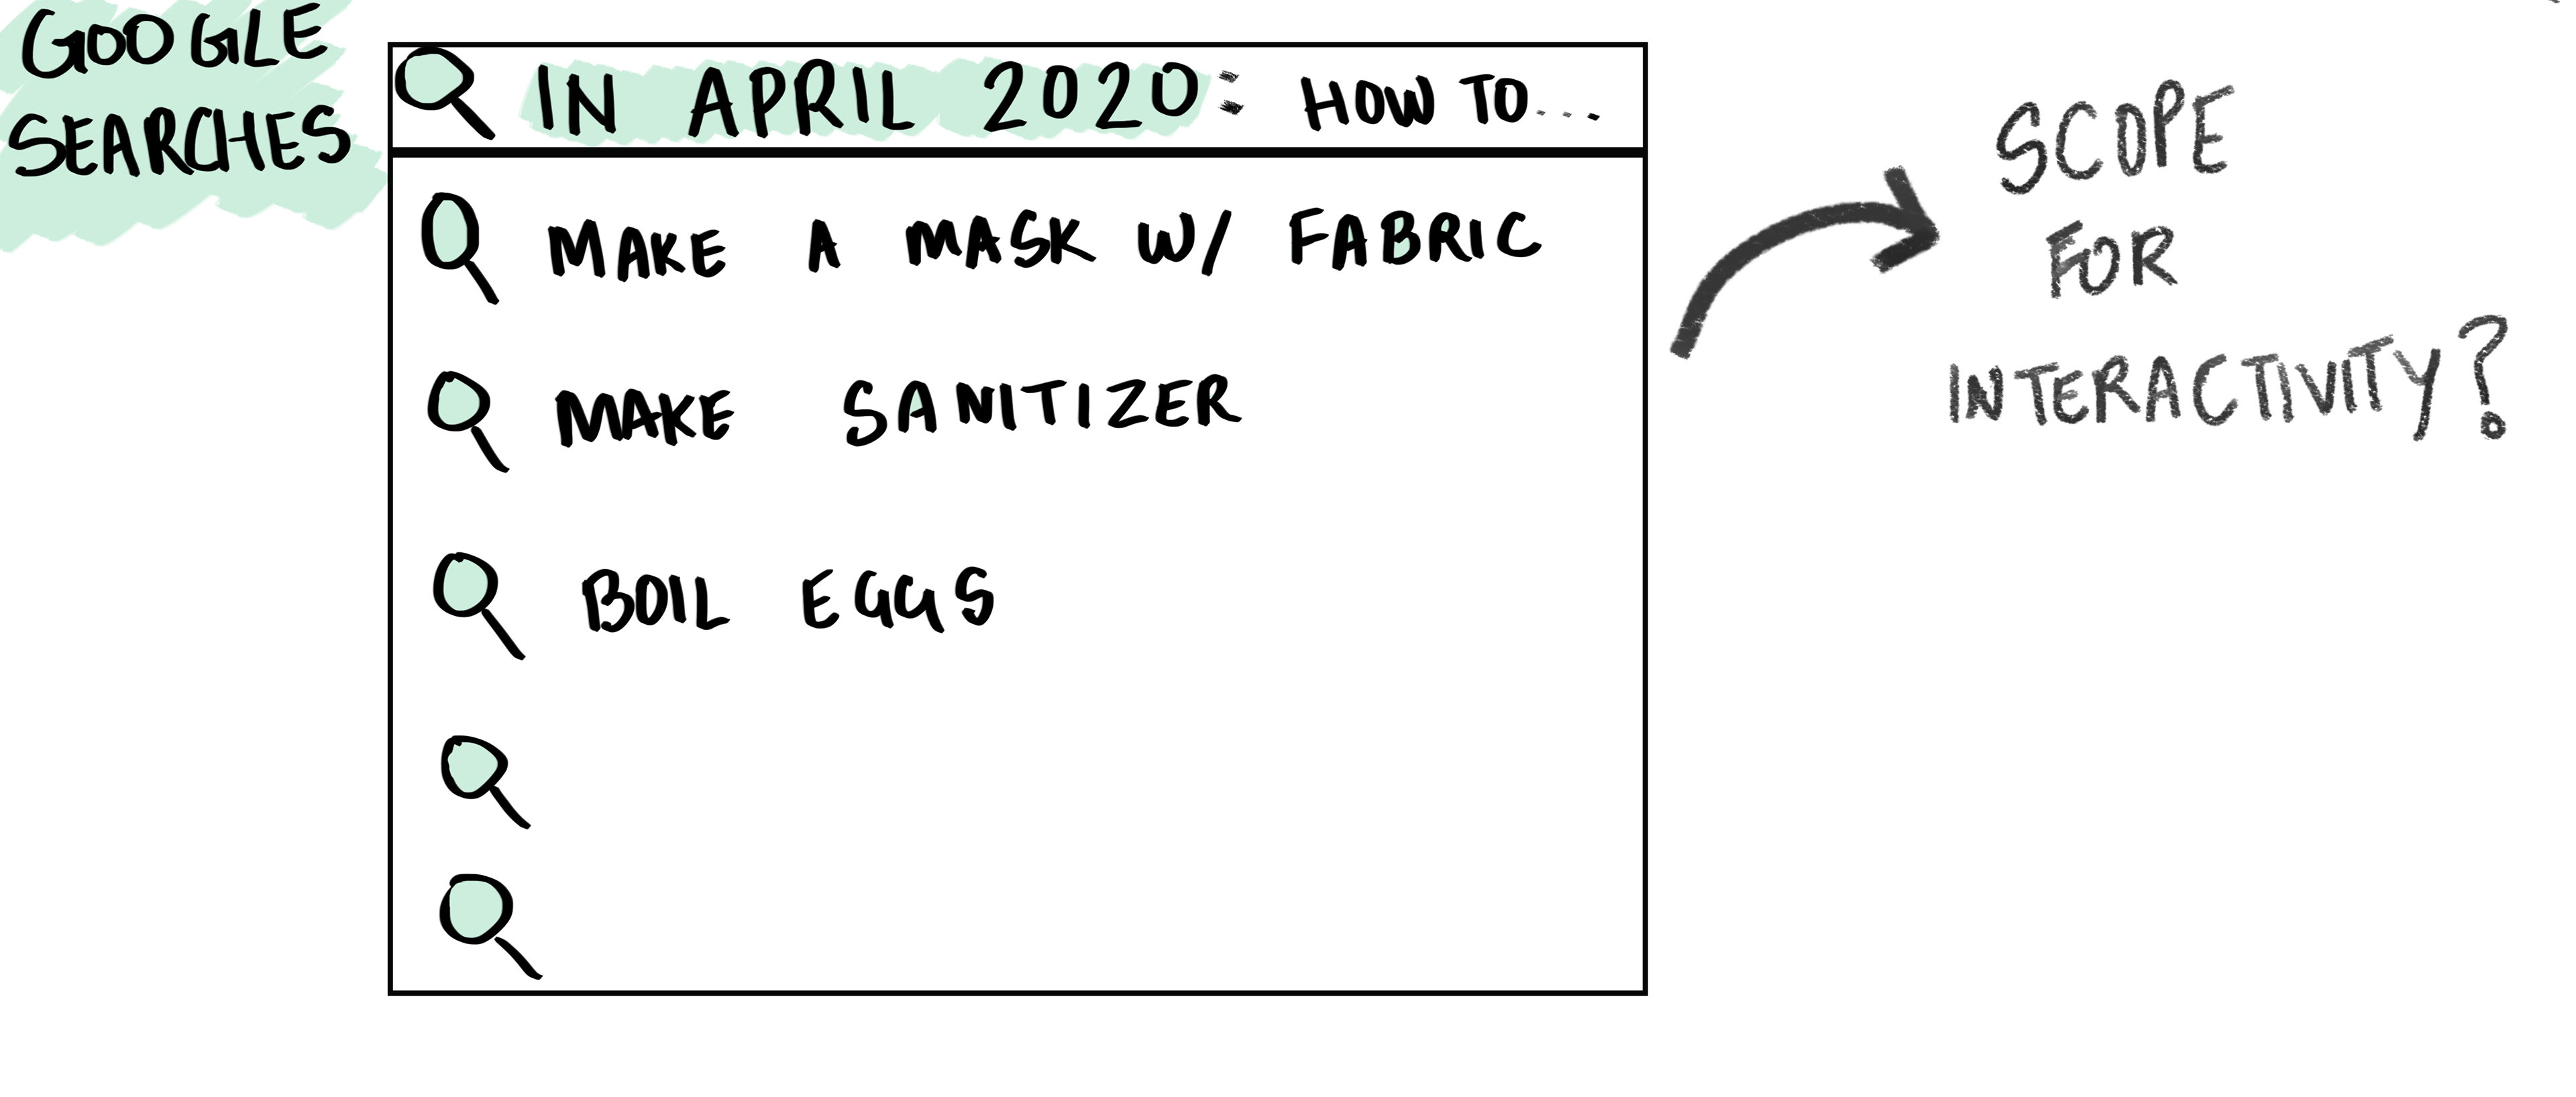
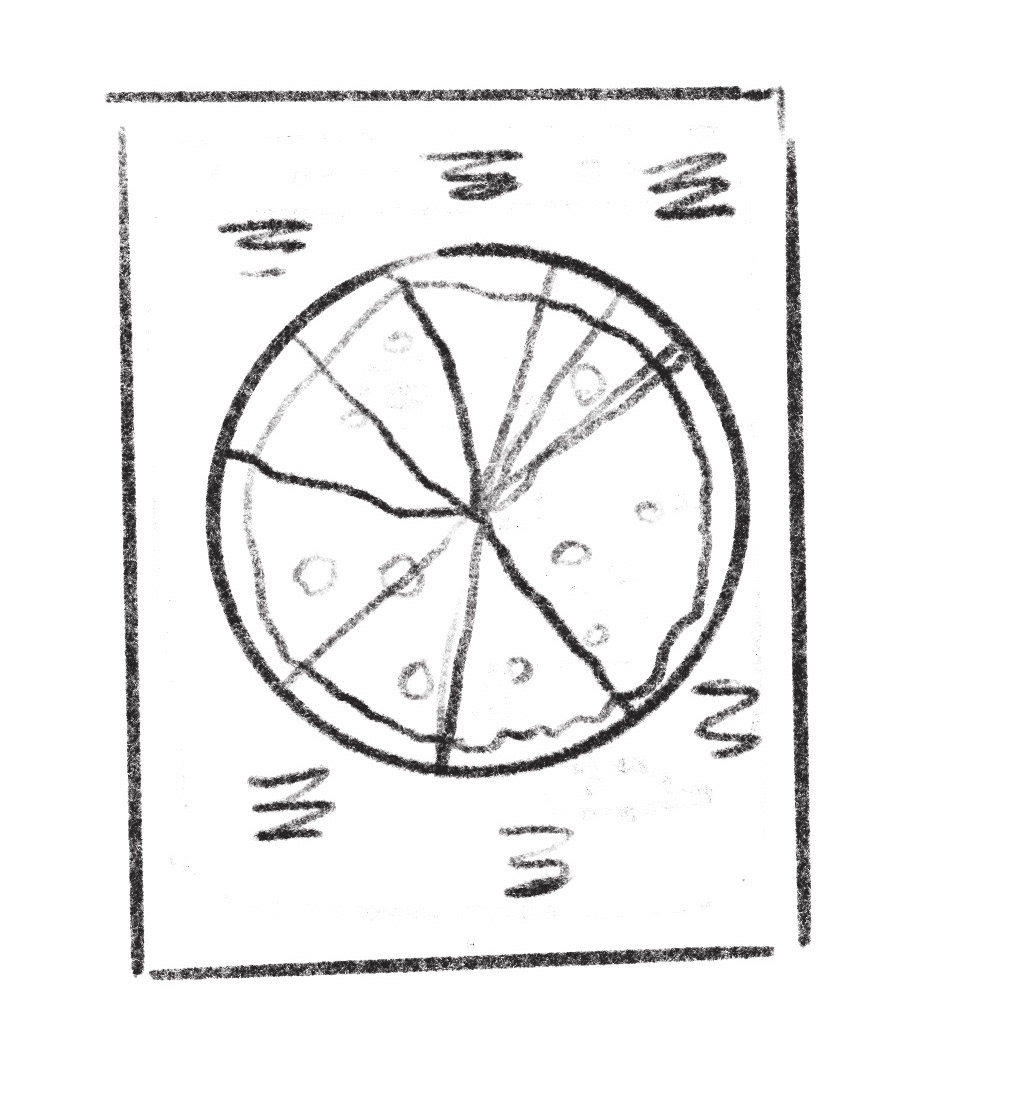
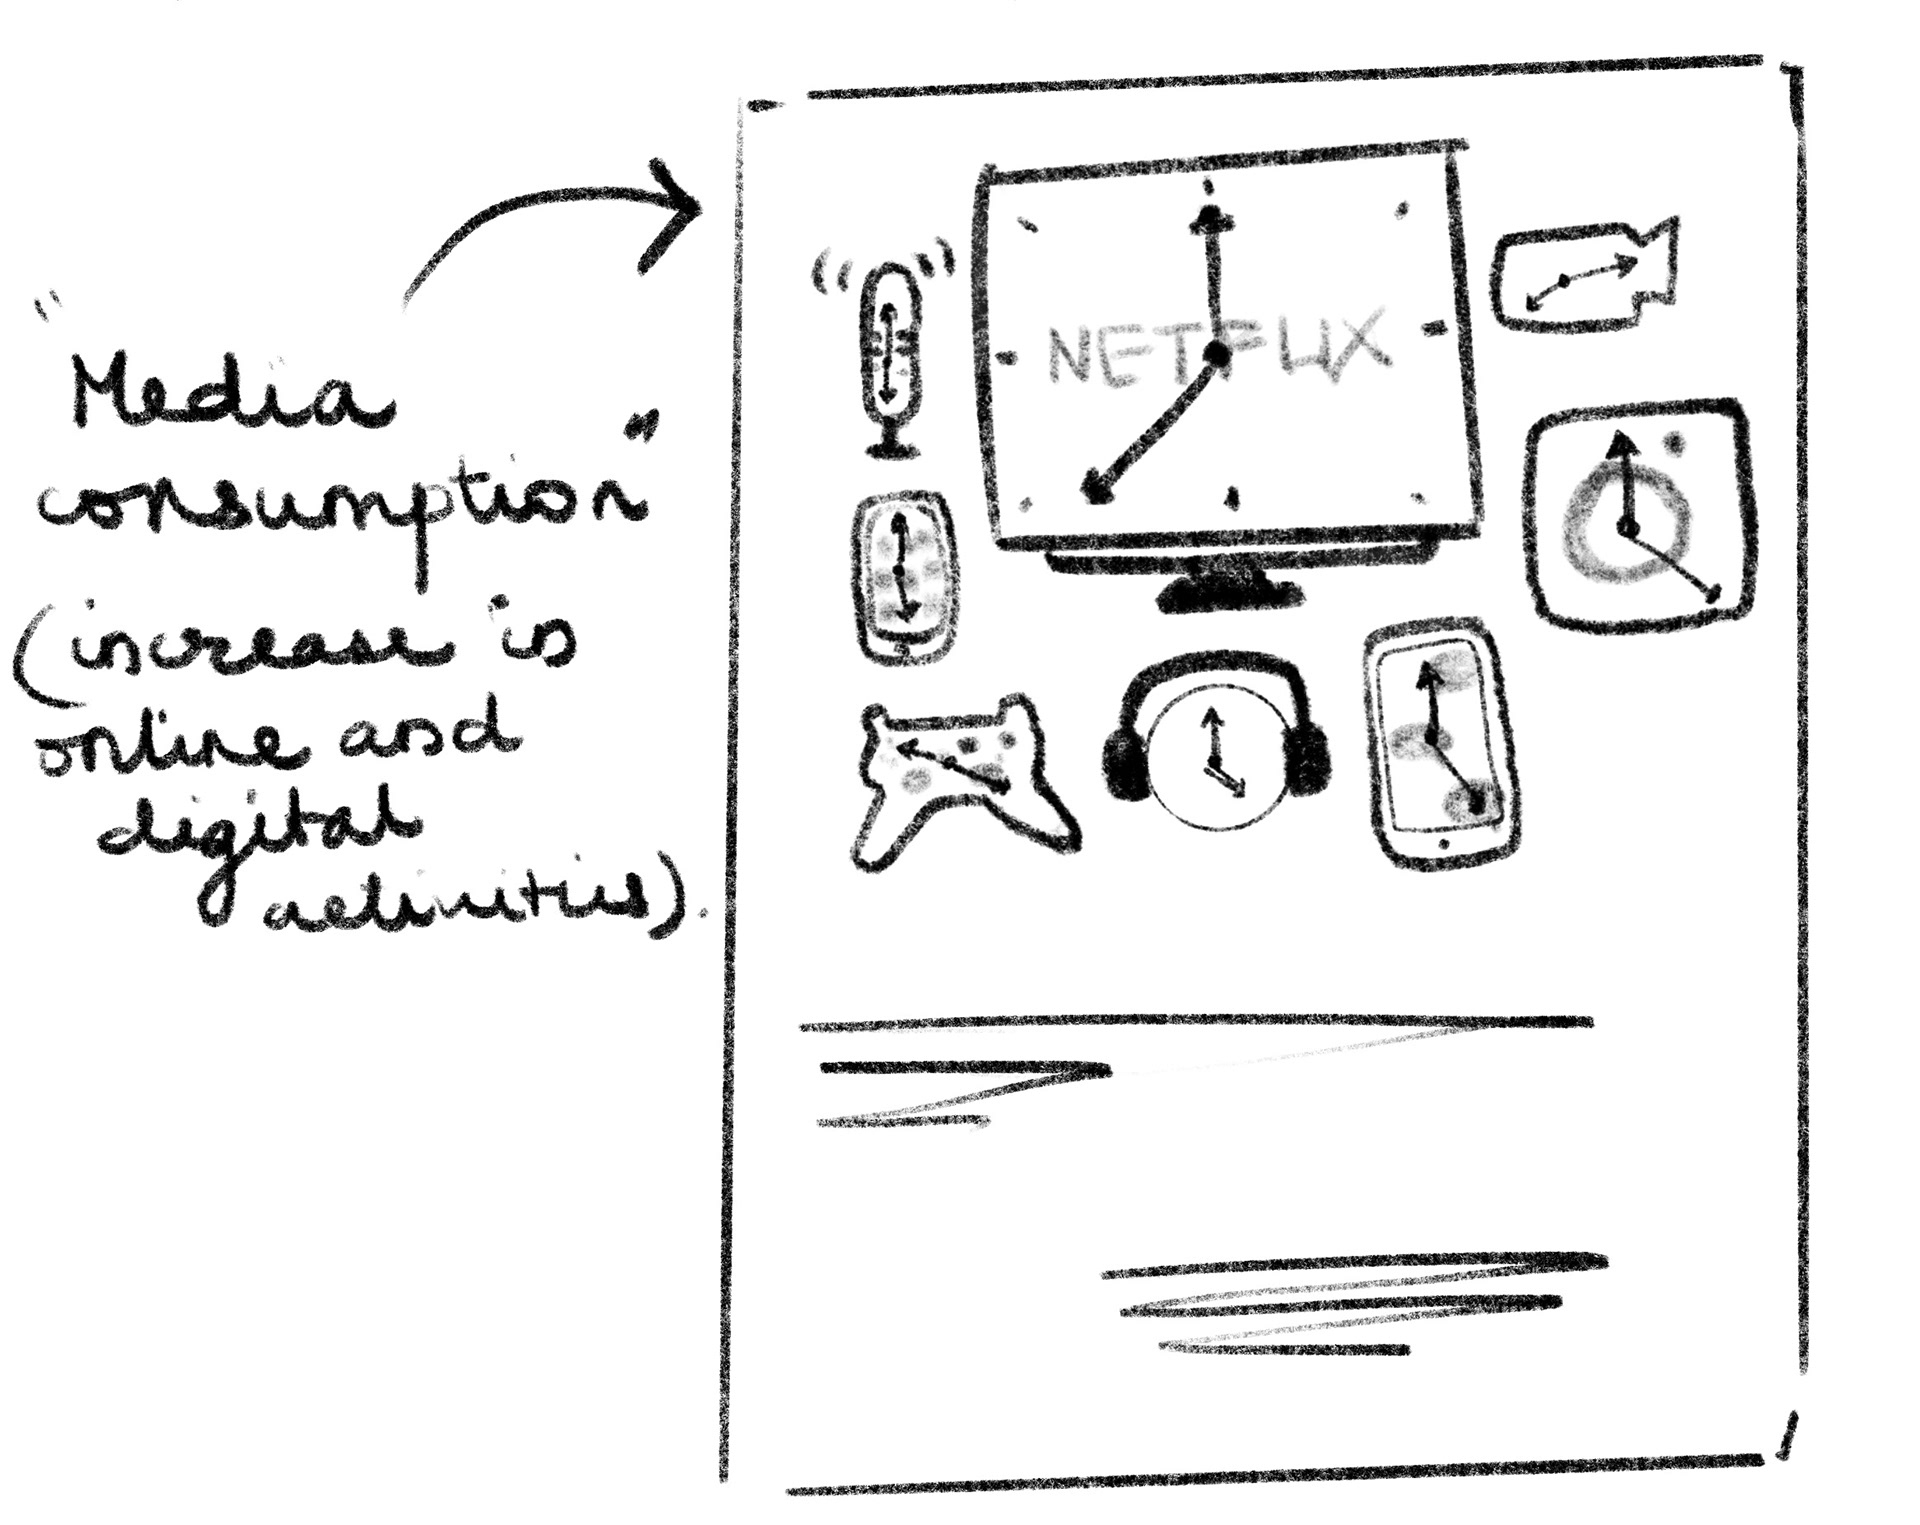
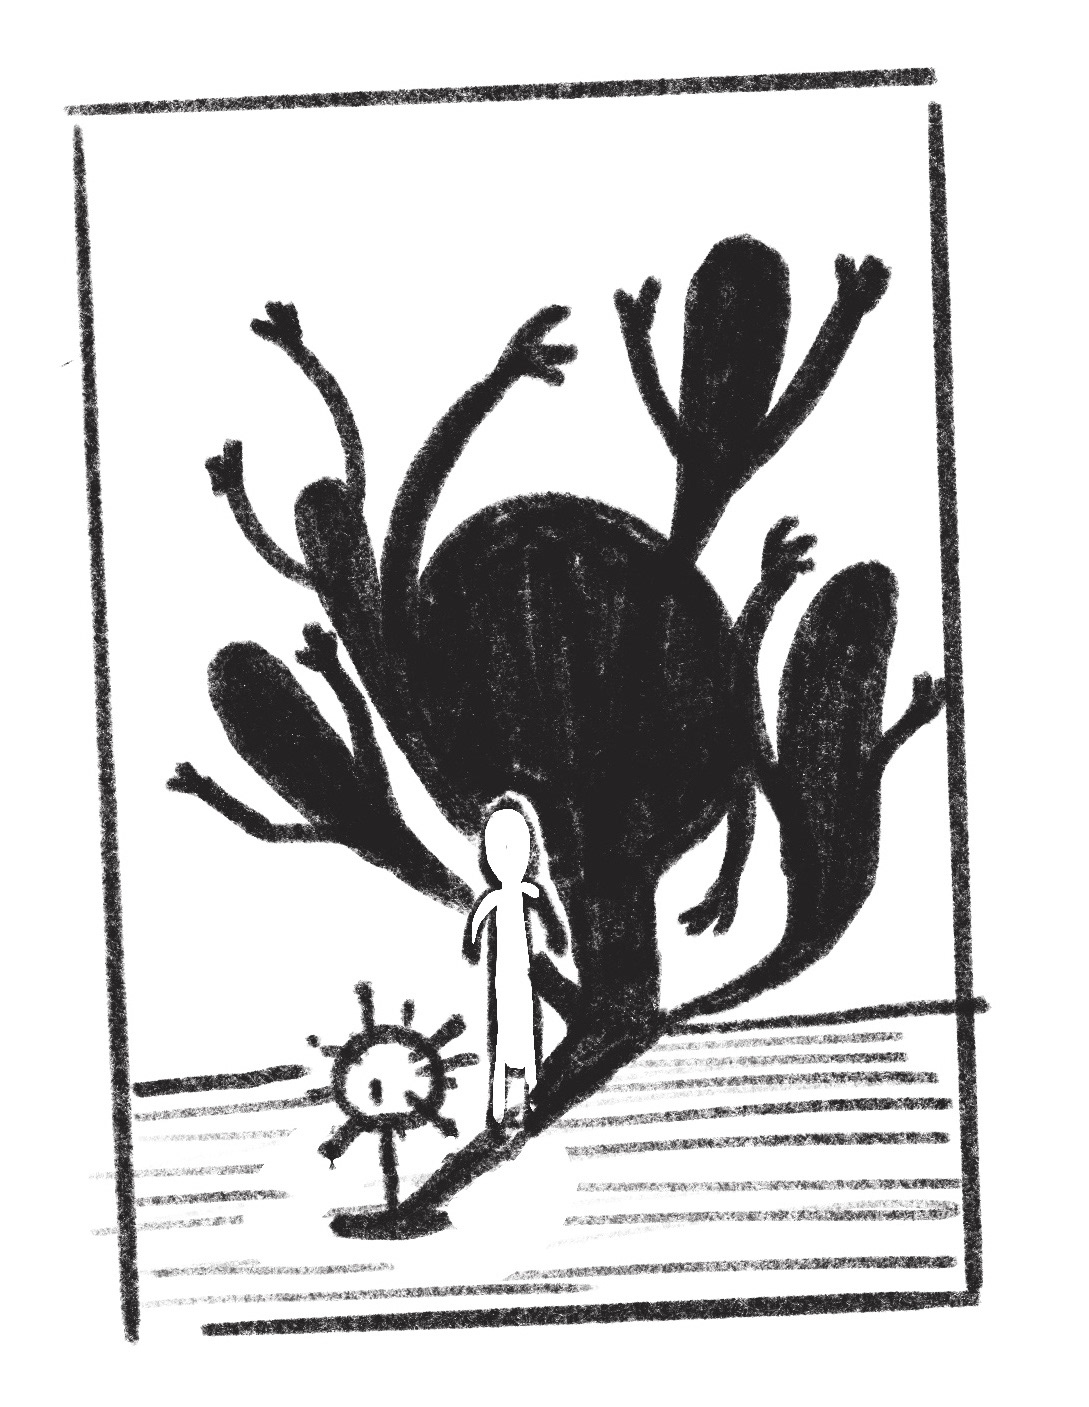
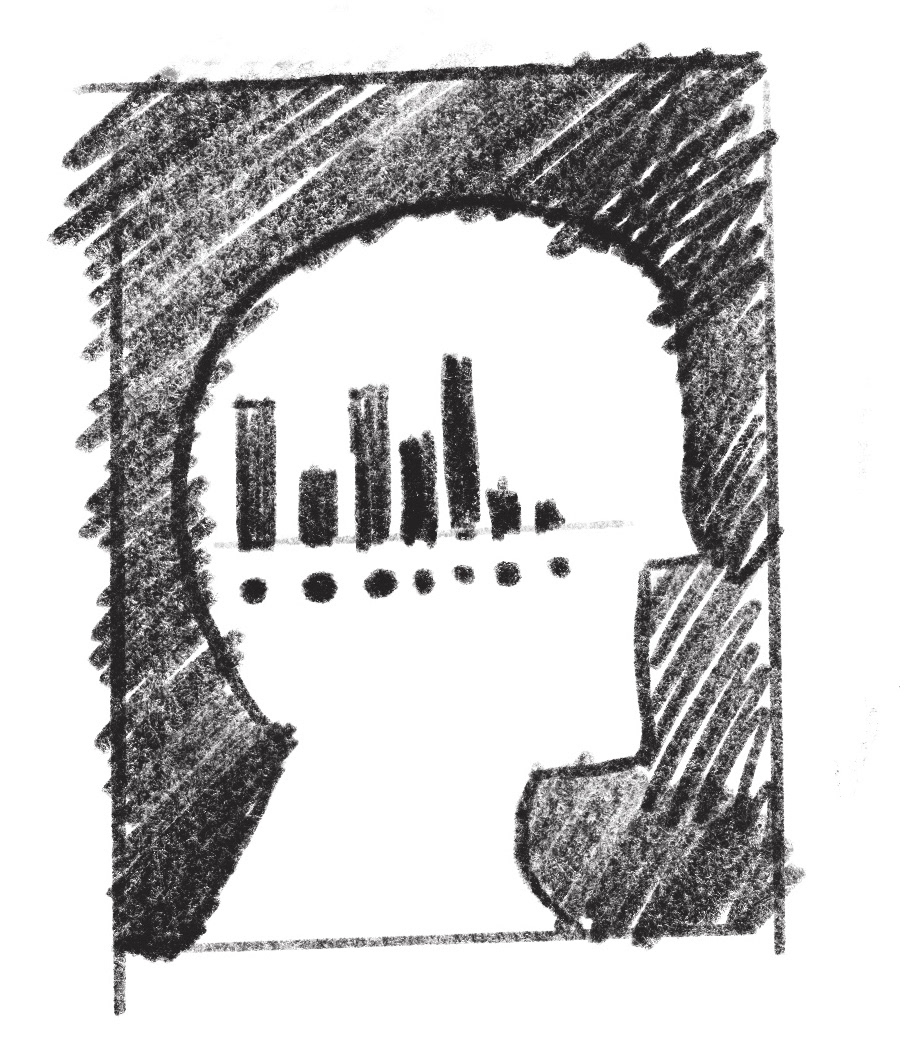
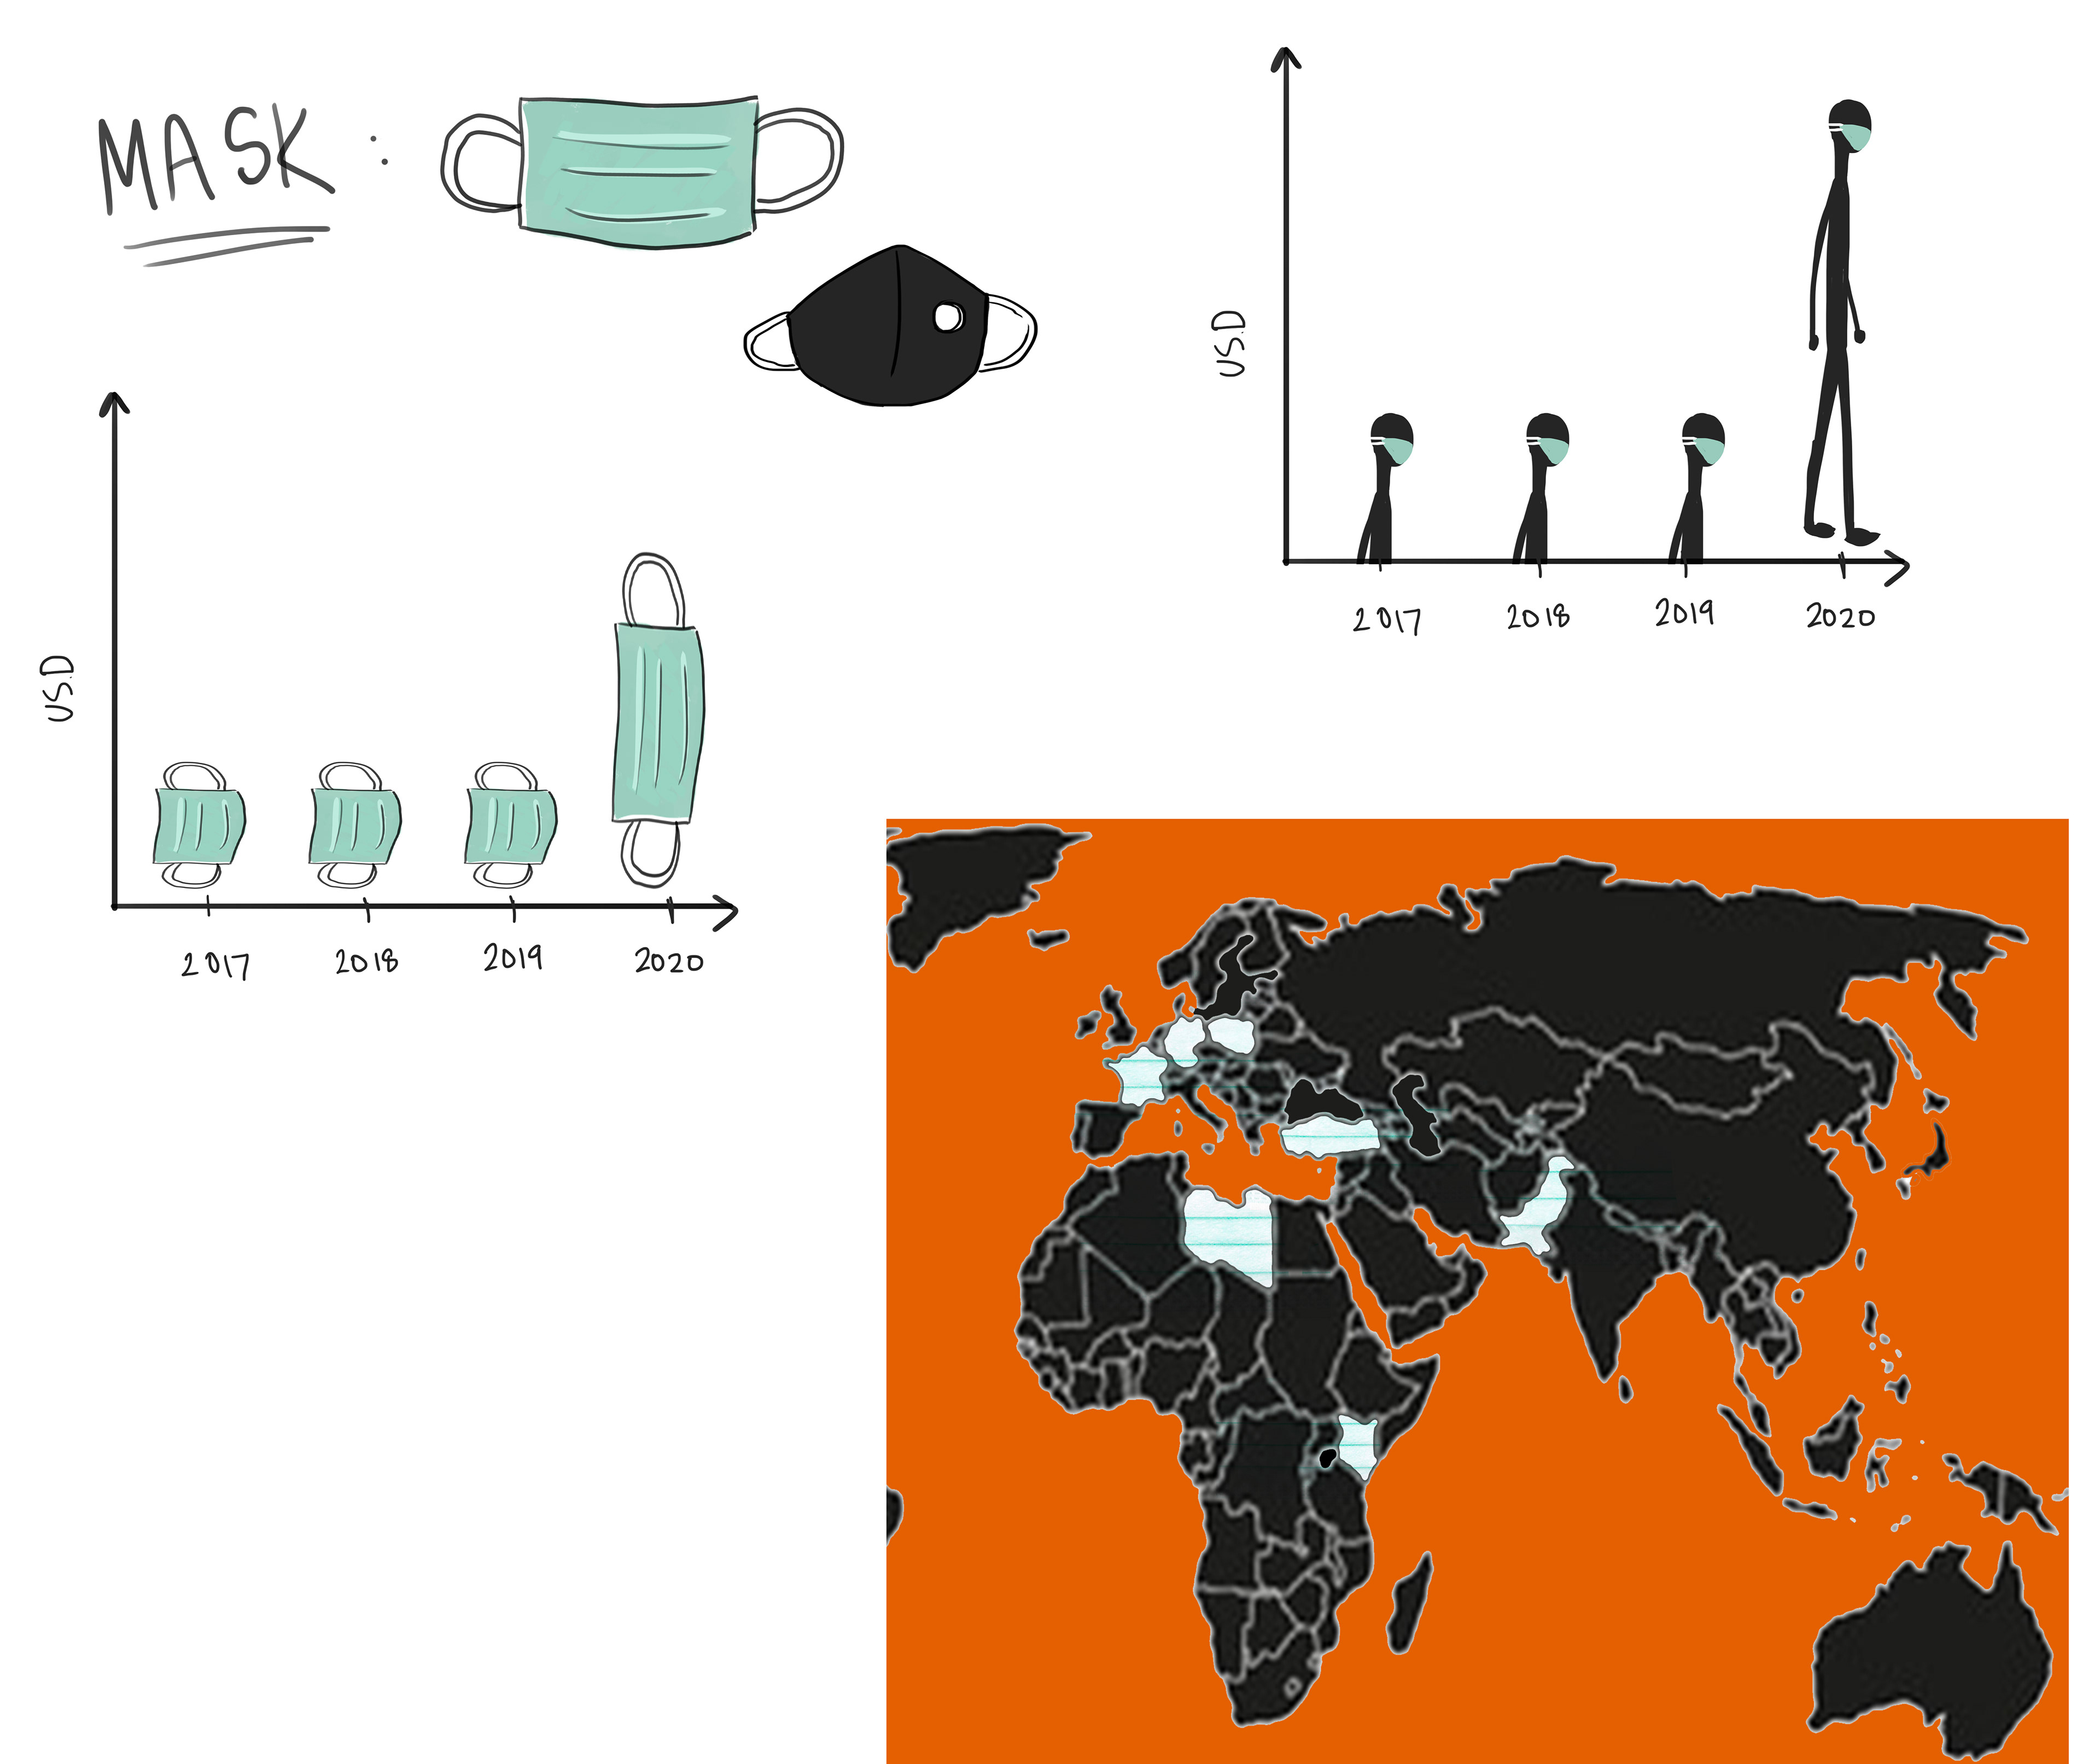
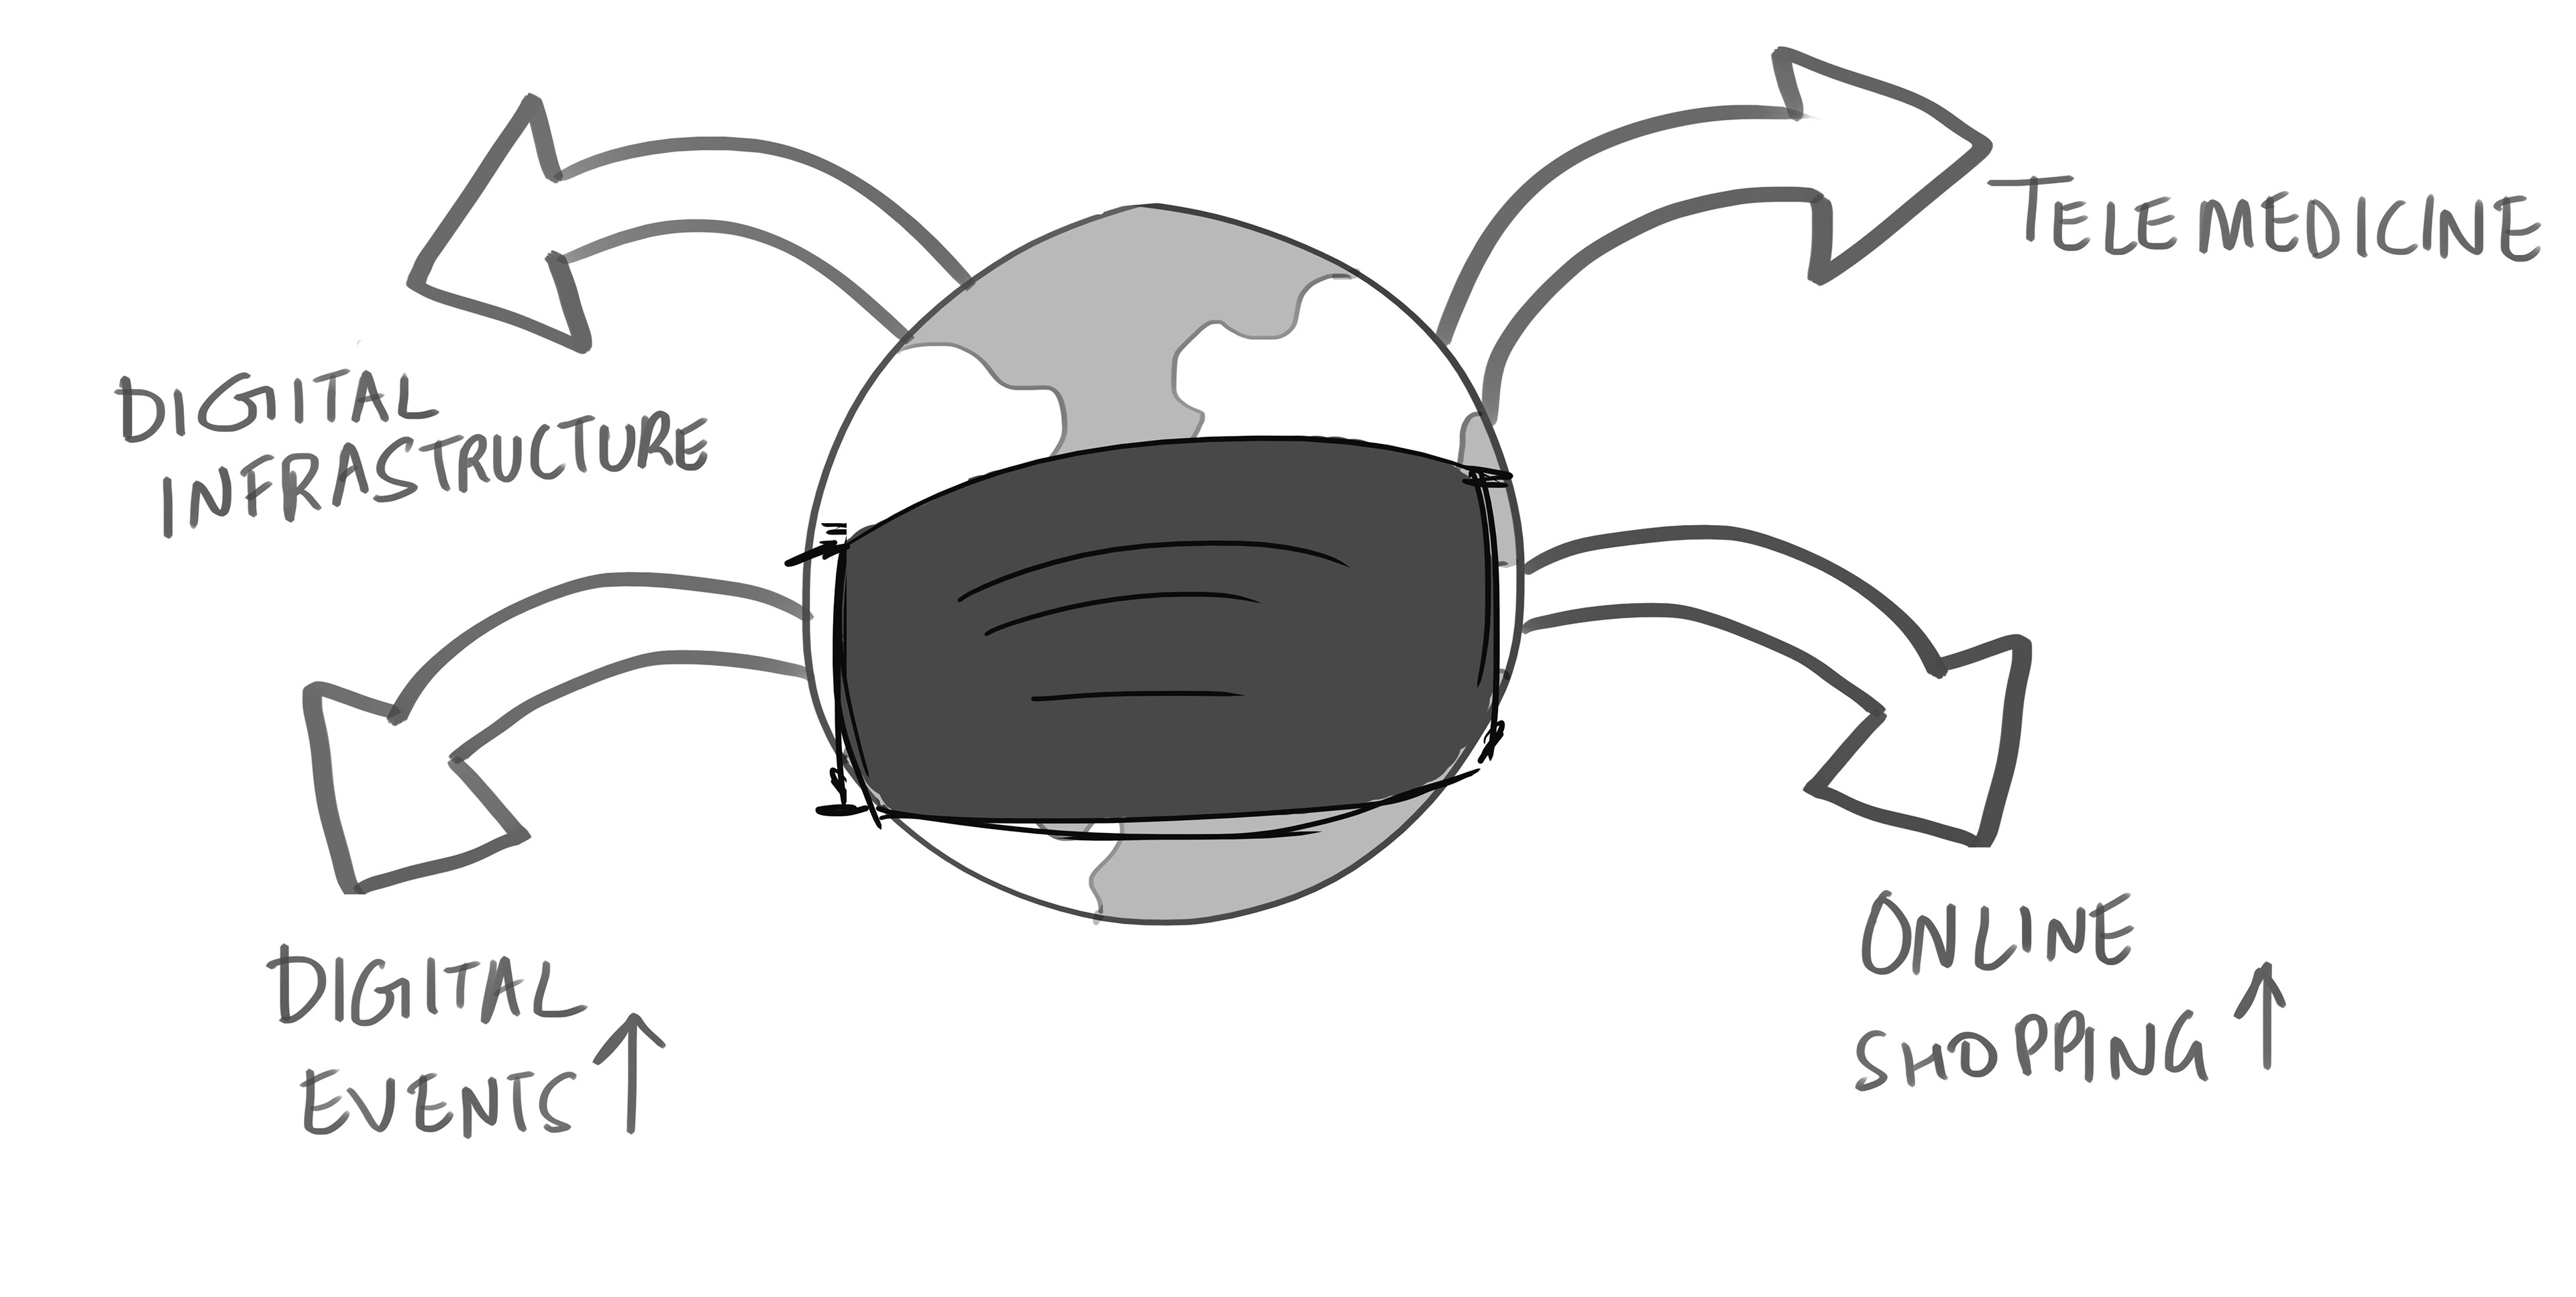
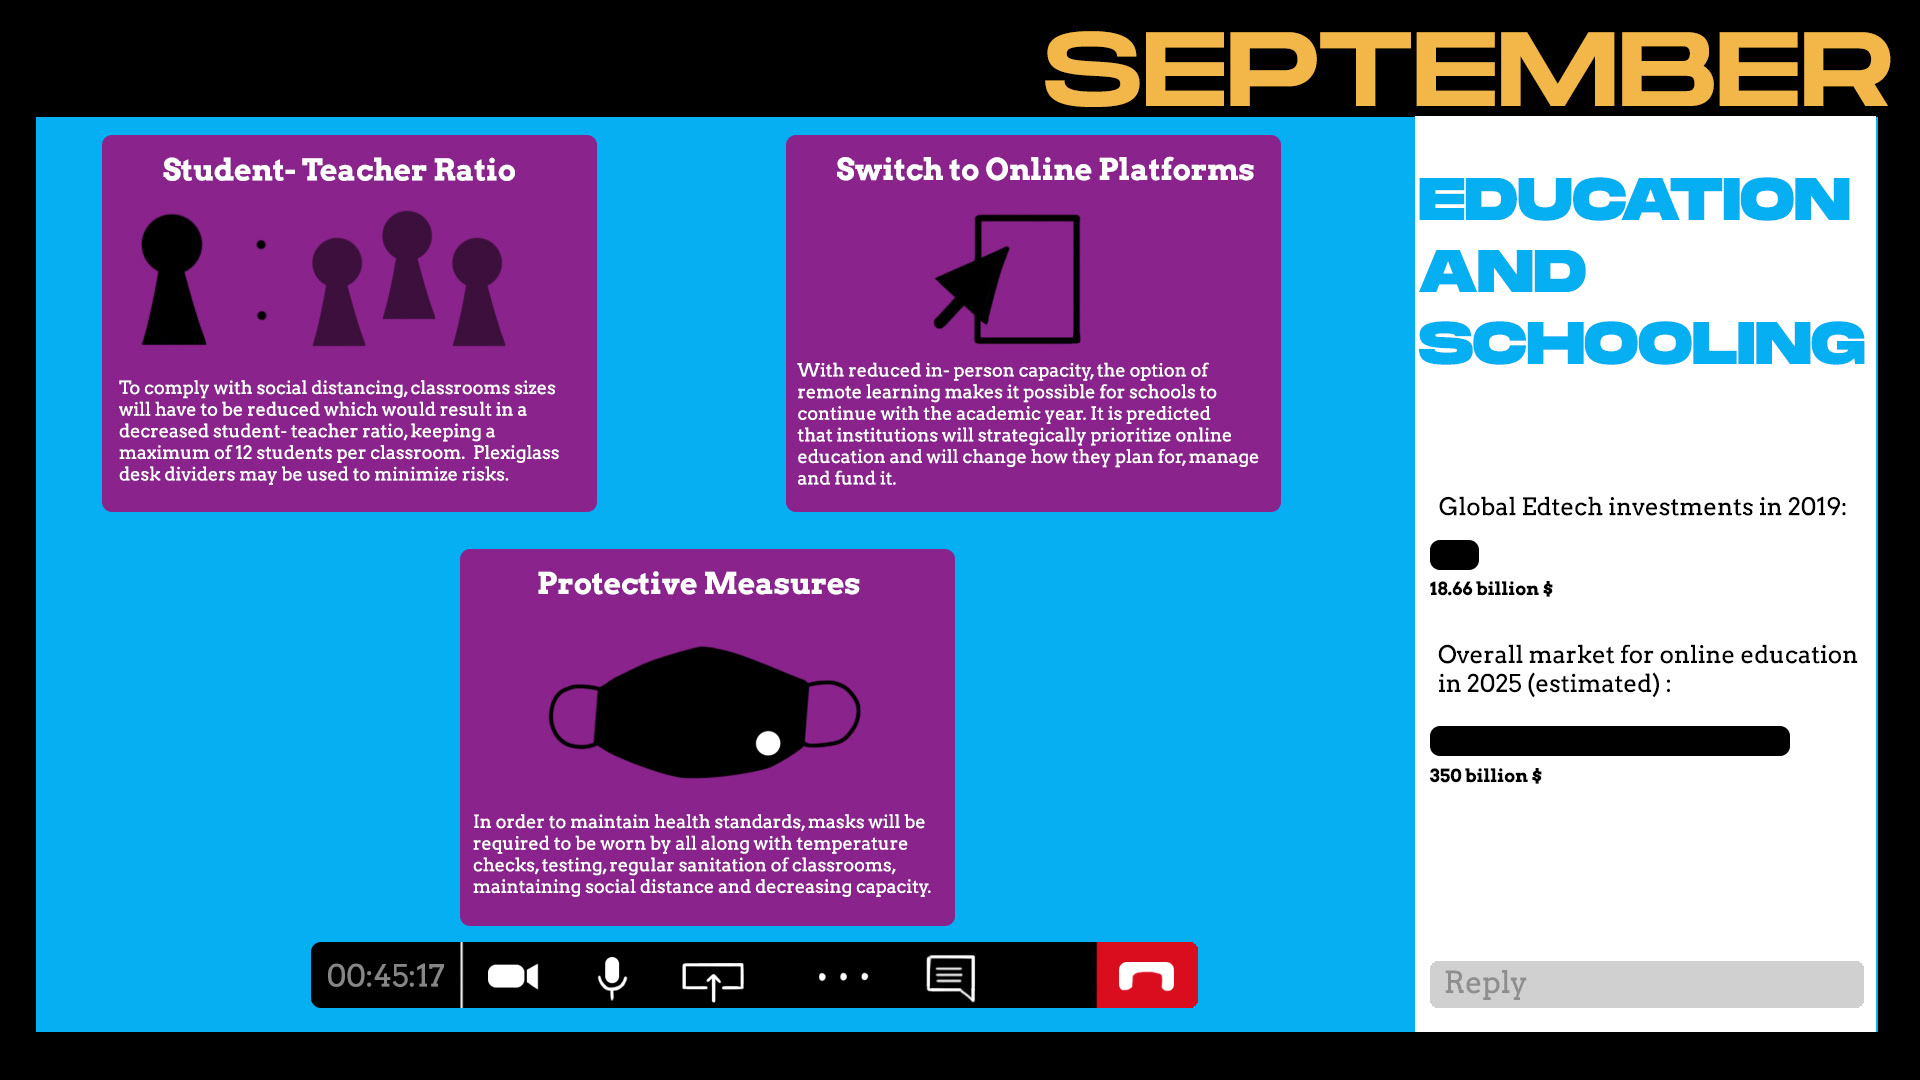
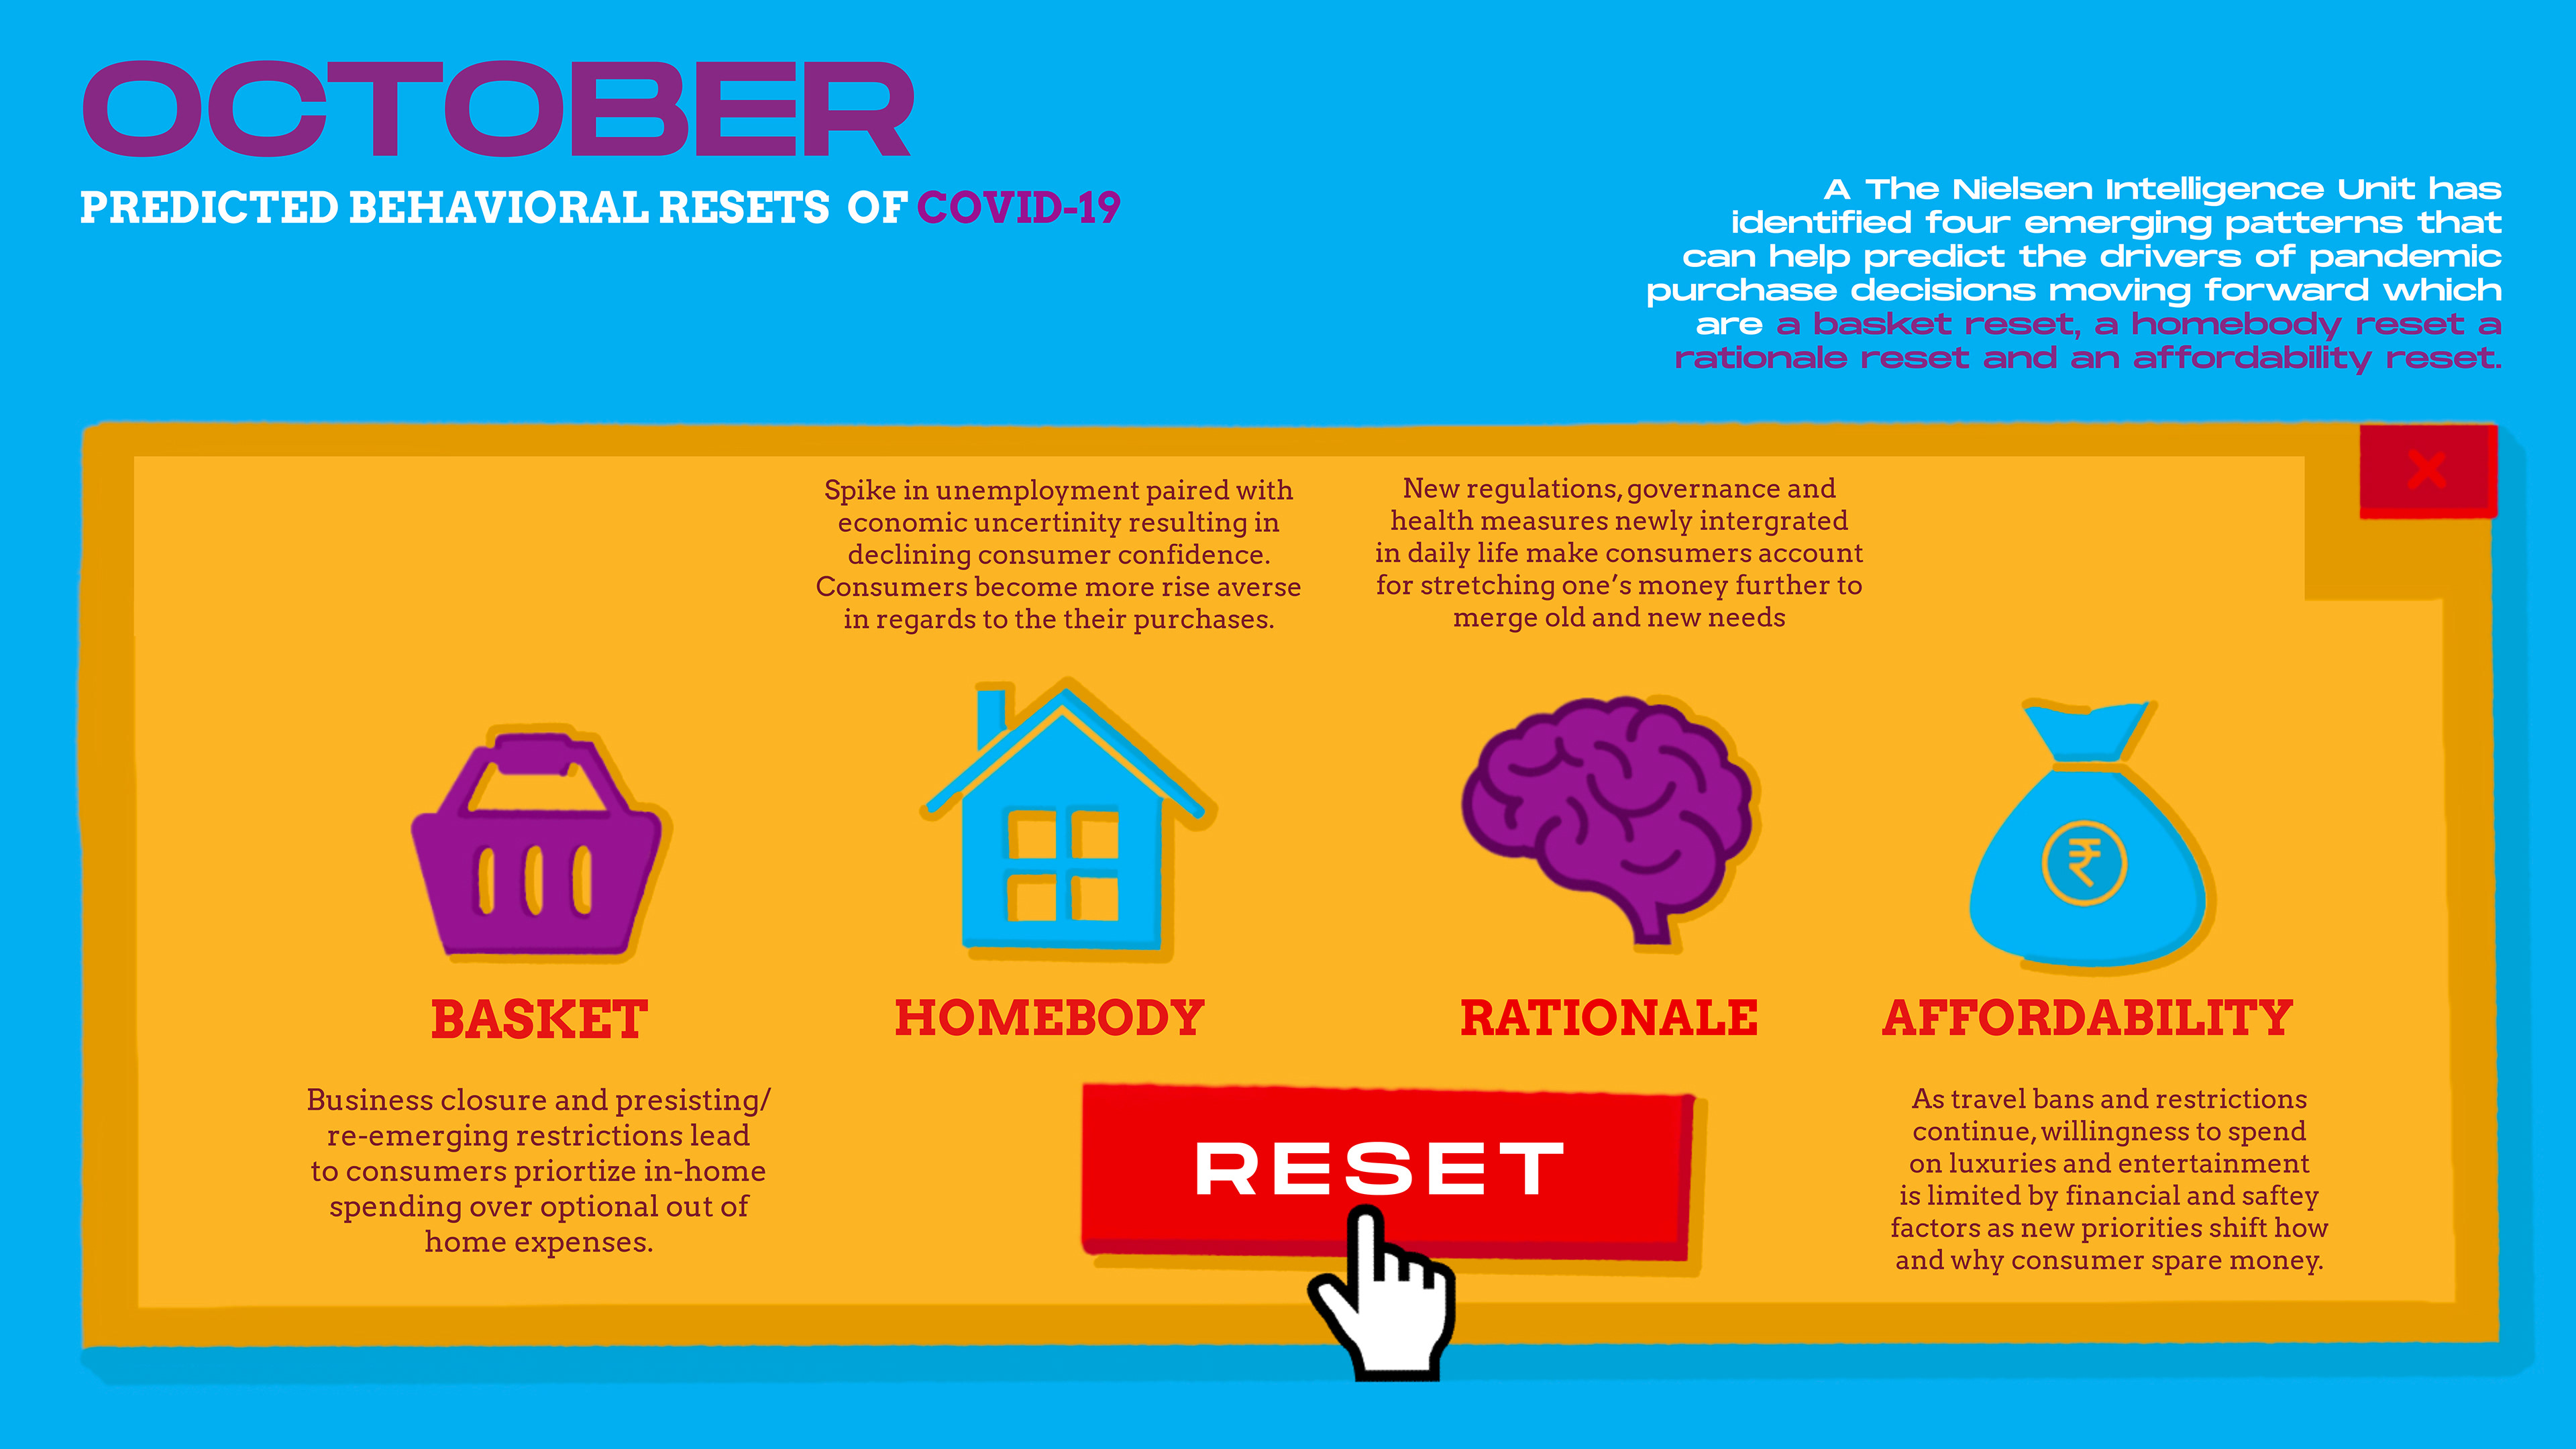
The Forecast Calendar explores the pandemic in the year 2020 through its various dimensions, such as social media usage, mask usage, google searches, global worries and food consumption.
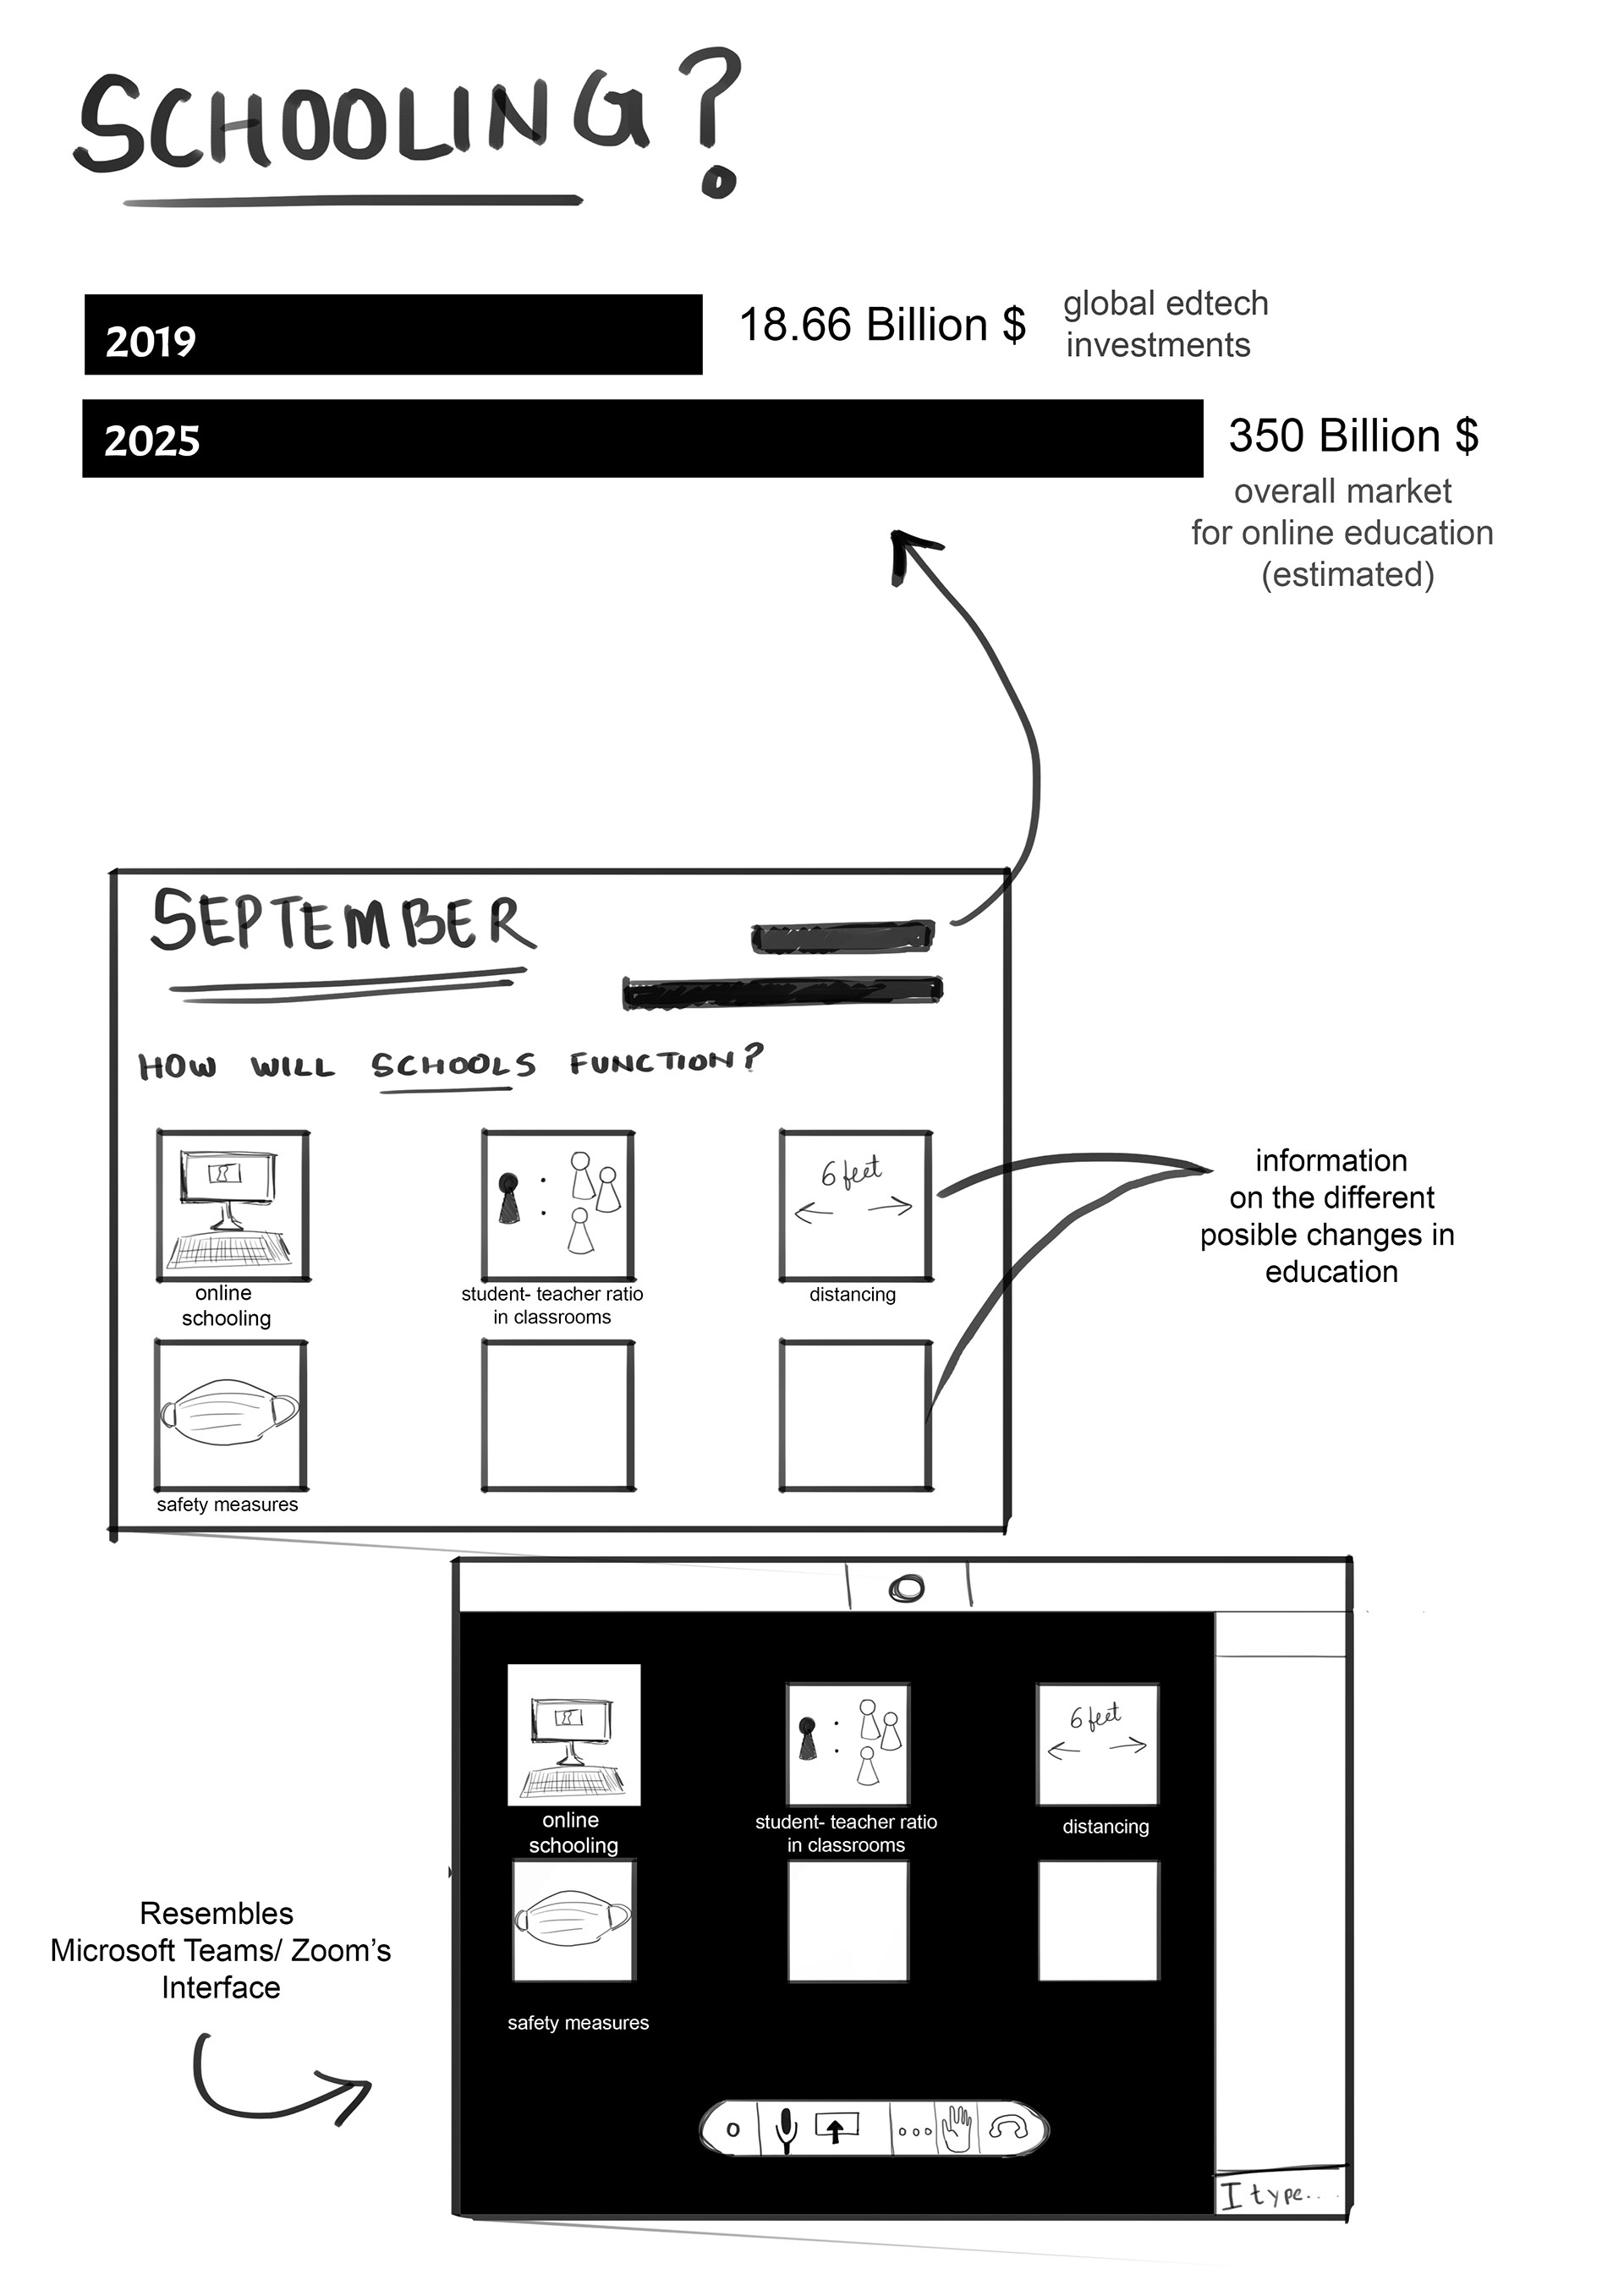
Each page is dedicated to a month and the respective dimension in relation to Covid-19, displaying data and information in a stimulating and visual way. The data visualizations and other elements have been animated to not only display the information clearly, but also to add significance and meaning to the data. We also considered the content of the information while designing the visual elements, in order to better convey the data to the audience. For the future months, the calendar makes predictions in world behaviours in various fields such as education, death toll, behaviours etc
We tried to approach the calendar in an unconventional way by combining animation and data visualization.
Concept Sketches